Image Details
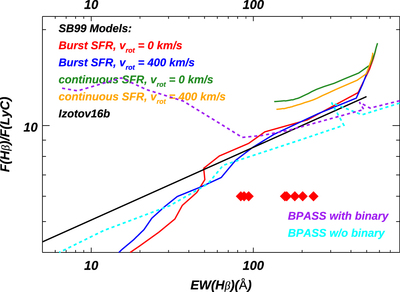
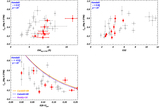
Caption: Figure 5.
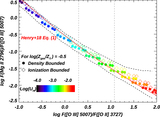
Comparisons of Hβ–LyC relationships between different stellar population models. F(LyC) is the model flux at 900 Å (rest frame). Models from Starburst99 (Leitherer et al. 1999) are listed in the upper left corner, where we choose either burst or continuous SFR with different rotation speeds. We show the fitted curve reported in Izotov et al. (2016b) as the black line. For BPASS models with burst SFRs, we show the cases with and without binary stars as purple and light-blue lines, respectively. Most of the models are consistent when EW(Hβ) ≳ 80 Å, but the trend from BPASS models with binary stars deviates from other models at EW(Hβ) < 80 Å. Since all galaxies in our sample have EW(Hβ) > 80 Å (shown as the red diamonds at arbitrary y-positions), our derived intrinsic flux of LyC is only weakly dependent on the choice of models. See Section 3.1.2.
Other Images in This Article
Show More
Copyright and Terms & Conditions
© 2022. The Author(s). Published by the American Astronomical Society.