Image Details
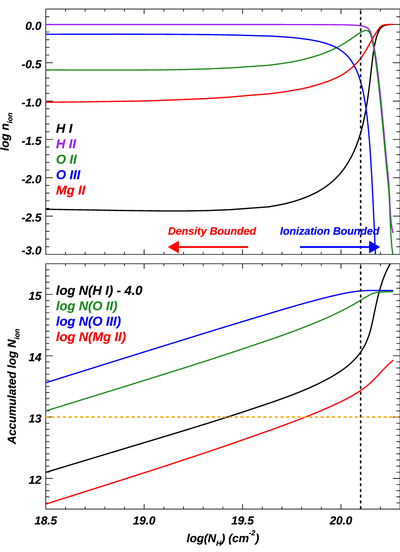
Caption: Figure 7.
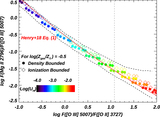
Physical structure of a photoionized cloud at the transition between H I and H II zones. Simulations are done using CLOUDY, and the adopted parameters are provided in Section 3.2.1. The position of the hydrogen Strömgren radius is indicated by the vertical black dashed line. The x-axis is the total hydrogen column density (N H). Top: comparison between N H and the ion population for certain elements in the y-axis, e.g., n(O III) = the number of O III ions/total oxygen ions in all states. The approximated regions for the two limiting cases of density and ionization bounds are indicated by the two arrows separately. Bottom: accumulated N ion for H I, O II, O III, and Mg II. For the curve of log(N(H I)), we scale it down by 4.0 dex to include it in the figure. The horizontal orange line represents N(H I) = 17.0 cm−2, where the cloud becomes optically thick to ionizing photons (see discussion in Section 3.2.1).
Other Images in This Article
Show More
Copyright and Terms & Conditions
© 2022. The Author(s). Published by the American Astronomical Society.