Image Details
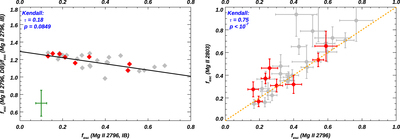
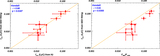
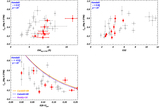
Caption: Figure 9.
Comparison of the ﹩{f}_{\mathrm{esc}}^{\mathrm{MgII}}﹩ values from the two limiting cases of DB and IB and two doublet lines. The eight galaxies in our sample are shown in red, while other possible LyC leakers from the literature with S/N of Mg II >̃ 3 are shown in gray (see Section 4.1). Left: the ratio of ﹩{f}_{\mathrm{esc}}^{\mathrm{MgII}}﹩ from DB to IB vs. ﹩{f}_{\mathrm{esc}}^{\mathrm{MgII}}﹩ from DB. We find general consistencies between the derived ﹩{f}_{\mathrm{esc}}^{\mathrm{MgII}}﹩ values. But ﹩{f}_{\mathrm{esc}}^{\mathrm{MgII}}﹩ from DB are always larger than the ones from IB as expected from the CLOUDY models (see discussion in Section 4.2). The black line represents the best linear fit, while the green cross represents the average error bar. Right: strong correlations between ﹩{f}_{\mathrm{esc}}^{\mathrm{MgII}}﹩ from Mg II λ λ2796 and 2803, assuming DB. The scatter is mainly due to the low S/N for Mg II λ2803 emission line from SDSS spectra. For each figure, Kendall's τ coefficient and the probability of the null hypothesis (p) are shown in the upper left corner. The dashed lines represent the 1:1 relationship.
Other Images in This Article
Show More
Copyright and Terms & Conditions
© 2022. The Author(s). Published by the American Astronomical Society.