Image Details
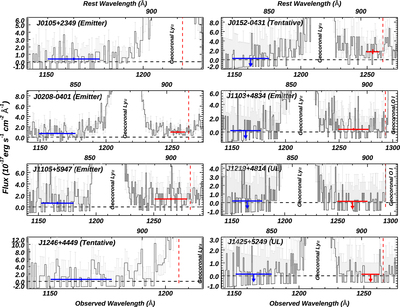
Caption: Figure 2.
The reduced spectra for the LyC regions (corrected for MW extinction). The HST/COS spectra are in black, while their errors are shown in gray. The location of the Lyman limit is indicated by the vertical red dashed lines. Strong geocoronal lines (Lyα and O I λ1302) are labeled. To minimize the contamination from geocoronal Lyα, we measure the flux of LyC from the blue and red windows that are away from the geocoronal Lyα. For each galaxy, the mean LyC flux is calculated by averaging the flux within a window that is shown with the horizontal blue or red lines. The corresponding uncertainties are indicated by the vertical solid line, or as arrows if no detections. Based on the measured LyC flux, we classify and label galaxies into three categories, i.e., LyC emitters, tentative LyC emitters, and upper limits (UL) on LyC. See details in Section 2.3.1.
Other Images in This Article
Show More
Copyright and Terms & Conditions
© 2022. The Author(s). Published by the American Astronomical Society.