Image Details
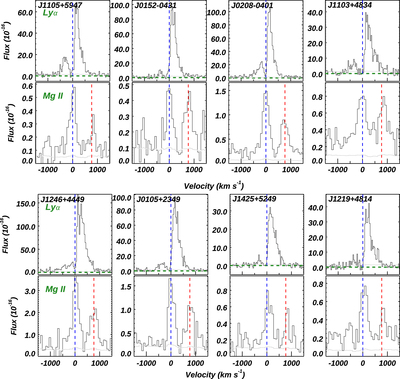
Caption: Figure 3.
Comparisons of the observed Lyα and Mg II profiles in velocity space, with data taken from HST/COS and SDSS, respectively. The y-axes are in units of 10−16 erg s−1 cm−2 Å−1. The data and corresponding errors are shown in black and gray. Objects are ordered by measured ﹩{f}_{\mathrm{esc}}^{\mathrm{LyC}}﹩ in Section 3.1.1, while the last two objects have ﹩{f}_{\mathrm{esc}}^{\mathrm{LyC}}﹩ as upper limits. The blue lines represent the v = 0 km s−1 for Lyα or Mg II λ2796, while the red lines represent v = 0 km s−1 for Mg II λ2803. The green dashed lines represent the positions of flux = 0 for Lyα panels.
Other Images in This Article
Show More
Copyright and Terms & Conditions
© 2022. The Author(s). Published by the American Astronomical Society.