Image Details
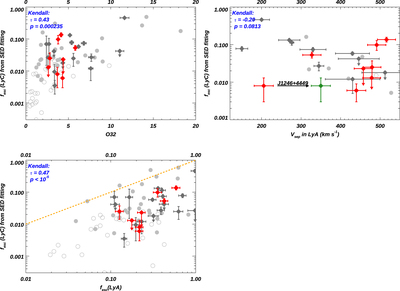
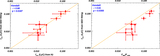
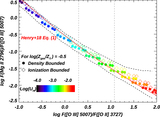
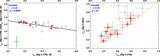
Caption: Figure 12.
Relationships between the escape fraction of Lyman continuum (﹩{f}_{\mathrm{esc}}^{\mathrm{LyC}}﹩, in y-axes) and three possible indirect indicators (x-axes): (1) ﹩{f}_{\mathrm{esc}}^{\mathrm{LyC}}﹩ vs. O32, (2) ﹩{f}_{\mathrm{esc}}^{\mathrm{LyC}}﹩ vs. the peak separation of Lyα emission line (V sep), and (3) ﹩{f}_{\mathrm{esc}}^{\mathrm{LyC}}﹩ vs. the escape fraction of Lyα. Galaxies from our Mg II selected sample are shown with red diamonds. Galaxies from comparison samples with high-S/N Mg II detections (Izotov et al. 2016a, 2018a, 2018b; Guseva et al. 2020; Izotov et al. 2021, and LzLCS) are shown with dark-gray diamonds. We also overlay other galaxies without high-S/N Mg II detections from the LzLCS sample. Their confirmed LyC leakers and nonleakers are shown with filled and open circles, respectively. In the right panel, galaxy J1246+4449 has two different V sep (shown in red and green) owing to its triple-peak Lyα feature (see Section 4.4). In the bottom panel, we show where y = x as the dashed orange lines.
Other Images in This Article
Show More
Copyright and Terms & Conditions
© 2022. The Author(s). Published by the American Astronomical Society.