Image Details
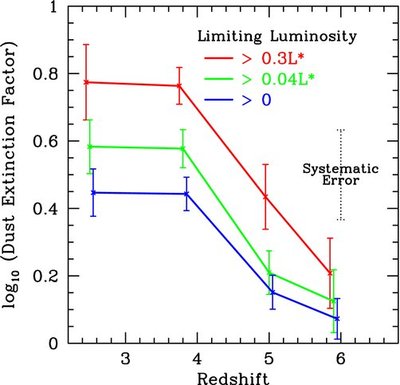
Caption: Figure 8.
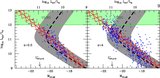
Effective dust extinction (at ~1600 Å) estimated for LBGs vs. redshift integrated down to a luminosity of 0.3 L* z = 3 (red lines), 0.04 L* z = 3 (green lines), and 0 (blue lines). The precise redshifts at which our dust extinction estimates are presented are shifted slightly to minimize overlap between the different limiting luminosities. The error bars shown here represent the random errors. The dotted error bar included on the right here is the systematic error that likely applies to each dust extinction estimate (based upon our conservative estimate that all β estimates in this paper are uncertain at the Δβ ~ ±0.15 level). This systematic error is unlikely to have any effect on the trends and differences seen here, but could change the overall scaling. The dust extinctions presented here are also given in Table 5. These extinctions are estimated based upon the distribution of UV-continuum slopes observed (Table 4) and the correlation between UV-continuum slope and dust obscuration observed at z~0–2 (Equation (1); Meurer et al. 1999). Note that the dust extinctions are much lower when integrated to very low luminosities.
Other Images in This Article
Show More
Copyright and Terms & Conditions
© 2009. The American Astronomical Society. All rights reserved.