Image Details
Caption: Figure 1.
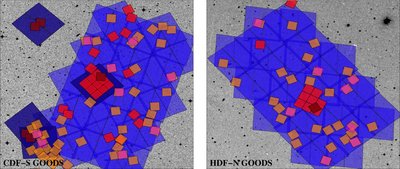
Illustration of the deep near-IR data available over the two GOODS fields. Deep near-IR data are essential for measurements
of the UV-continuum slope of galaxies at
z
![]() 5 and valuable for a measurement of these slopes at
z ~ 4. The red and dark red regions correspond to regions with deep and very deep NICMOS
J
110 and
H
160 coverage, respectively (5σ depths
5 and valuable for a measurement of these slopes at
z ~ 4. The red and dark red regions correspond to regions with deep and very deep NICMOS
J
110 and
H
160 coverage, respectively (5σ depths
![]() 26.5 and
26.5 and
![]() 28 AB mag). The light orange regions have deep NICMOS
H
160-band coverage (5σ depths of
28 AB mag). The light orange regions have deep NICMOS
H
160-band coverage (5σ depths of
![]() 26.5; H. Teplitz et al. 2009, in preparation; C. Conselice et al. 2009, in preparation) while the magenta regions have deep
NICMOS
J
110-band coverage (5σ depths of
26.5; H. Teplitz et al. 2009, in preparation; C. Conselice et al. 2009, in preparation) while the magenta regions have deep
NICMOS
J
110-band coverage (5σ depths of
![]() 26.5; R.J. Bouwens et al. 2009, in preparation). The blue and dark blue regions correspond to regions with deep and very deep
optical ACS
V
606
i
775
z
850 coverage, respectively (5σ depths of
26.5; R.J. Bouwens et al. 2009, in preparation). The blue and dark blue regions correspond to regions with deep and very deep
optical ACS
V
606
i
775
z
850 coverage, respectively (5σ depths of
![]() 28 and
28 and
![]() 29 AB mag). For more details on the NICMOS data over the two GOODS fields, see Bouwens et al. (2008) and R. J. Bouwens et
al. (2009, in preparation).
29 AB mag). For more details on the NICMOS data over the two GOODS fields, see Bouwens et al. (2008) and R. J. Bouwens et
al. (2009, in preparation).
Other Images in This Article
Show More
Copyright and Terms & Conditions
© 2009. The American Astronomical Society. All rights reserved.