Image Details
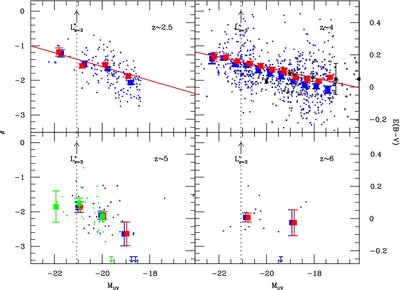
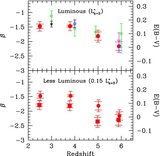
Caption: Figure 3.
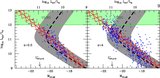
Determinations of the UV-continuum slope β (1600–2300 Å) vs. rest-frame UV luminosity for the present selection of z ~ 2.5 U, z ~ 4 B, z ~ 5 V, and z ~ 6 i dropouts. The UV luminosity here is the geometric mean of the UV luminosities measured in the bands used to establish the UV slope (see Table 2). On the right axes are the equivalent E( B − V) extinctions (Calzetti et al. 2000 law) to a given β if the base spectrum is a young star-forming galaxy (~100 Myr of constant star formation)—which is only Δ E( B − V) = 0.02 bluer than our fiducial τ model (i.e., the one referred to in footnote b of Table 2). The small points represent the UV-continuum slopes measured for individual galaxies in our samples while the open blue squares and vertical bars show the mean UV-continuum slope β and 1σ scatter (shown in a darker blue in the z ~ 4 panel for clarity). Blue upper limits are shown for a few z ~ 5 and z ~ 6 sources with β's bluer than −3.5. The green points on the z ~ 5 panel show the UV-continuum slope determinations derived from our V-dropout samples where only NICMOS H 160-band data are available (i.e., with no deep NICMOS J 110-band coverage). The black points on the z ~ 4 panel show the UV-continuum slope determinations derived from our B-dropout samples behind lensing clusters (where we have corrected their luminosities for model lensing magnification factors; see Section 3.6). It is encouraging that the UV-continuum slopes we derive from both of the latter V- and B-dropout selections agree with the determinations derived from our primary selections. The open red squares and vertical bars show the mean UV-continuum slope and 1σ error in this slope, after correcting for the effect of object selection and photometric scatter (Section 3.7). See Table 4 for a tabulation of these slopes. The red lines show the best-fit relationship between UV-continuum slope and the observed magnitude of a galaxy in the UV (see Sections 3.9 and 4.5). It is also clear that the UV-continuum slope β of star-forming galaxies is much redder at higher luminosities than it is at lower luminosities (particularly at z ~ 2.5 and z ~ 4).
Other Images in This Article
Show More
Copyright and Terms & Conditions
© 2009. The American Astronomical Society. All rights reserved.