Image Details
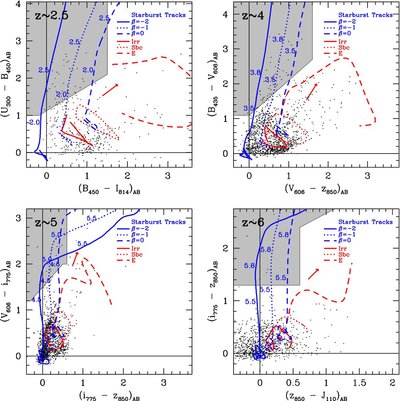
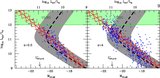
Caption: Figure 2.
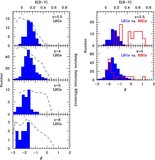
Two-color diagrams showing the selection criteria (see Section 3.2) we use to find z ~ 2.5 U, z ~ 4 B, z ~ 5 V, and z ~ 6 i dropouts in our search fields (upper left, upper right, lower left, and lower right panels, respectively). Sources that fall within the shaded regions would be included in our selections. The blue tracks show the expected colors of starbursts with different UV-continuum slopes as a function of redshift, while the red lines show the colors of low-redshift interlopers (Coleman et al. 1980). The black points illustrate the range of colors that real sources in our search fields possess. To ensure that these plotted distributions of colors are as realistic as possible, we only include sources from our deepest fields (the HDFs for our U-dropout selection and HUDF for our B-, V-, and i-dropout selection) and at relatively bright magnitudes ( I < 26 for our U-dropout selection, z < 26.5 for our B-dropout selection, and z < 27 for our V-, i-dropout selections). The red arrows show the Calzetti et al. (2000) reddening vectors. These diagrams show that our selection criteria are effective in identifying high-redshift galaxies with UV-continuum slopes β bluer than 0.5, but less effective in identifying galaxies redward of this limit (Figures 4 and 6 show the effective selection volume calculated to be available to galaxies with various UV-continuum slopes).
Other Images in This Article
Show More
Copyright and Terms & Conditions
© 2009. The American Astronomical Society. All rights reserved.