Image Details
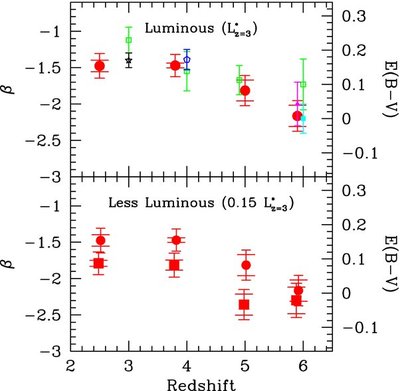
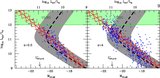
Caption: Figure 5.
Top: determinations of the mean UV-continuum slope β for galaxies with a UV luminosity of L* z = 3 ( M UV ~ −21) as a function of redshift (solid red circles). The error bars in β are ⩾0.15 and include possible systematic errors in both the measured colors and corrections for selection effects. The error bars in β (with the wider horizontal bars) are for the random errors. The random errors are generally much smaller than those including the estimated systematic errors (shown with the narrower horizontal bars). The right axes give the equivalent E( B − V) extinctions (Calzetti et al. 2000 law) for a given β if the input spectrum is a young star-forming galaxy (~100 Myr of constant star formation). Published determinations of the mean UV-continuum slope β at z ~ 3 (black star; Adelberger & Steidel 2000), at z ~ 4 (blue open pentagon; Ouchi et al. 2004), at z ~ 6 (solid cyan square; Stanway et al. 2005 and solid magenta triangle; Bouwens et al. 2006), and at z~4–6 (green open squares; Hathi et al. 2008) are also plotted. L* z = 3 galaxies are found to have bluer colors at z ~ 5–6 than they do at z ~ 2–4. Bottom: determinations of the mean UV-continuum slope β for galaxies with a UV luminosity of 0.15 L* z = 3 ( M UV ~ −19) as a function of redshift (solid red squares). For comparison, our determinations of the mean UV-continuum slope β at L* z = 3 (from top panel) are included in this panel as solid red circles (and offset somewhat from the lower luminosity determinations in redshift for clarity). For each of our dropout samples, the lower luminosity galaxies are found to be bluer.
Other Images in This Article
Show More
Copyright and Terms & Conditions
© 2009. The American Astronomical Society. All rights reserved.