Image Details
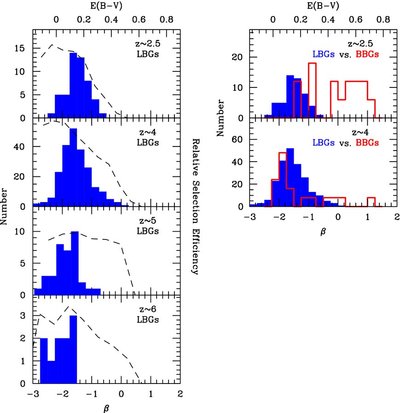
Caption: Figure 6.
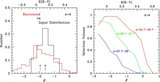
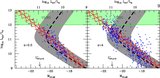
Left: distribution of UV-continuum slopes β observed at
z ~ 2–6 for the present LBG selections (solid blue histograms). We only include the observed β values for LBGs >1 mag brighter
than the selection limit to avoid being dominated by selection effects. On the top axes are the
E(
B −
V) extinctions (Calzetti et al. 2000 law) that are equivalent to a given β if the base spectrum is a young star-forming galaxy
(~100 Myr of constant star formation). The selection volume (Section 3.7) available for galaxies with UV-continuum slope β
and magnitudes
![]() 1 mag brighter than the selection limit is shown with the thick dashed lines in each panel (the normalization is arbitrary).
While it is more difficult to select galaxies with redder UV-continuum slopes β with a Lyman break criterion, our simulations
(Section 3.7) indicate that our dropout selections should be capable of identifying modest numbers of galaxies with β's as
red as 0.5. Indeed, such galaxies (with β's redder than −1) are present in our
z ~ 2–4 LBG selections albeit in small numbers. However, they are conspicuously absent in our
z
1 mag brighter than the selection limit is shown with the thick dashed lines in each panel (the normalization is arbitrary).
While it is more difficult to select galaxies with redder UV-continuum slopes β with a Lyman break criterion, our simulations
(Section 3.7) indicate that our dropout selections should be capable of identifying modest numbers of galaxies with β's as
red as 0.5. Indeed, such galaxies (with β's redder than −1) are present in our
z ~ 2–4 LBG selections albeit in small numbers. However, they are conspicuously absent in our
z
![]() 5 selections. This suggests that such sources are exceedingly rare at
z
5 selections. This suggests that such sources are exceedingly rare at
z
![]() 5. Conversely, the modest number of galaxies with red UV-continuum slopes β's seen at
z ~ 4 seem consistent with the small samples of
z ~ 4 ULIRGs that have been found in the observations (e.g., Daddi et al. 2009). The lack of very blue β ≲ −3 galaxies is also
consistent with expectations from models and suggest that the β distributions derived here are reliable. Right: distribution
of UV-continuum slopes observed for LBG selections at
z ~ 2–4 (solid blue histogram) and for BBG selections at
z ~ 2–4 (red histogram; Brammer & van Dokkum 2007). The
E(
B −
V) extinctions given on the top axis are as in the left panel (but are not expected to be particularly representative for the
somewhat older BBGs). Both β distributions plotted are as observed, with no correction for selection or measurement effects.
BBG selections provide us with an independent measure of the UV-continuum slope distribution since they do not depend upon
their UV-continuum slope or the brightness of these sources in the UV-continuum. The fact that the distribution of UV-continuum
slopes β is becoming substantially bluer for both selections (and in particular the Brammer & van Dokkum 2007 BBG selection
at
z ~ 4) suggests that Lyman-break selections (sensitive to galaxies with β's bluer than 0.5: see Figures
2 and
4) should be largely complete at
z
5. Conversely, the modest number of galaxies with red UV-continuum slopes β's seen at
z ~ 4 seem consistent with the small samples of
z ~ 4 ULIRGs that have been found in the observations (e.g., Daddi et al. 2009). The lack of very blue β ≲ −3 galaxies is also
consistent with expectations from models and suggest that the β distributions derived here are reliable. Right: distribution
of UV-continuum slopes observed for LBG selections at
z ~ 2–4 (solid blue histogram) and for BBG selections at
z ~ 2–4 (red histogram; Brammer & van Dokkum 2007). The
E(
B −
V) extinctions given on the top axis are as in the left panel (but are not expected to be particularly representative for the
somewhat older BBGs). Both β distributions plotted are as observed, with no correction for selection or measurement effects.
BBG selections provide us with an independent measure of the UV-continuum slope distribution since they do not depend upon
their UV-continuum slope or the brightness of these sources in the UV-continuum. The fact that the distribution of UV-continuum
slopes β is becoming substantially bluer for both selections (and in particular the Brammer & van Dokkum 2007 BBG selection
at
z ~ 4) suggests that Lyman-break selections (sensitive to galaxies with β's bluer than 0.5: see Figures
2 and
4) should be largely complete at
z
![]() 5 (see Section 4.2).
5 (see Section 4.2).
Other Images in This Article
Show More
Copyright and Terms & Conditions
© 2009. The American Astronomical Society. All rights reserved.