Image Details
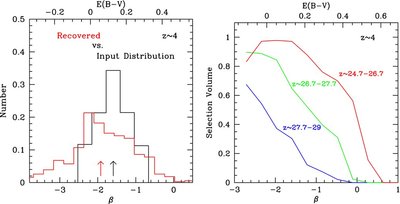
Caption: Figure 4.
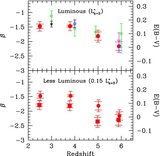
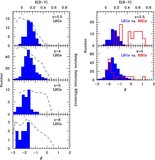
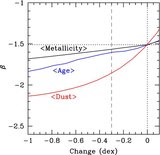
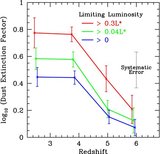
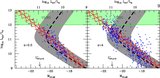
Left: comparison between the UV-continuum slope β distribution input into the simulations (black histogram) and that directly recovered from the simulations (red histogram; which included the effect of object selection and measurement error). This panel is for our faintest, lowest S/N z ~ 4 B-dropout selection over the HUDF ( z 850-band magnitudes of 28–29). Both the input (and recovered) distributions are normalized to have the same area. On the top axes are the E( B − V) extinctions (Calzetti et al. 2000 law) that are equivalent to a given β if the base spectrum is a young star-forming galaxy (~100 Myr of constant star formation). The median UV-continuum slope β input into the simulations and that recovered are shown with the black and red arrows, respectively. The recovered distribution of UV-continuum slopes is broader and peaked to somewhat bluer values than the input distribution. For our higher S/N selections, the differences between the input and recovered distributions are much smaller (the offsets between the red and blue squares in Figure 3 show the size of the corrections). For our faintest selections (as shown here) the differences can be larger. It is nonetheless reassuring that when these corrections are applied there is agreement between the mean UV-continuum slopes estimated in our shallower selections (where the corrections are larger) and in our deeper selections (where the corrections are smaller). For example, the mean UV-continuum slope derived at z 850, AB ~26.5–27 for our GOODS B-dropout selections (i.e., −1.81 ± 0.04 at −19.2 AB mag) agrees very well with that derived from our much higher S/N HUDF selections for the GOODS fields (i.e., −1.73 ± 0.07 for the HUDF). (right) The selection volumes (arbitrary units) available to galaxies for our B-dropout selection over the HUDF vs. UV-continuum slope β. Shown are the relative selection volumes for galaxies with z 850~24.7–26.7 (red line), z 850~26.7–27.7 (green line), and z 850~27.7–29.0 (blue line). We emphasize that the same normalization for the selection volume is used for all the three magnitude selections, demonstrating that it is much easier to select galaxies with red UV-continuum slopes at bright magnitudes than it is at faint magnitudes. The reason bright z ~ 4 galaxies are easier to select is that one needs to confirm that a source has a large Lyman break at >1σ, and this is easier to do at bright magnitudes. Selection biases and measurement errors are less for brighter samples (where the S/N is higher) and greater for fainter samples. The two panels here demonstrate how important it is for us to correct for selection biases and measurement uncertainties as we do in Section 3.7.
Other Images in This Article
Show More
Copyright and Terms & Conditions
© 2009. The American Astronomical Society. All rights reserved.