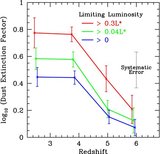
Image Details
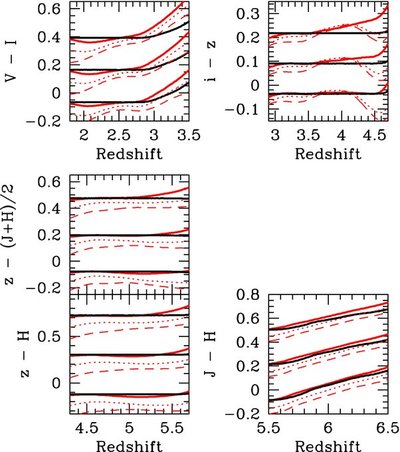
Caption: Figure 15.
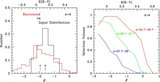
Expected UV colors for star-forming galaxies in our z ~ 2.5 U, z ~ 4 B, z ~ 5 V, and z ~ 6 i-dropout selections. The black lines (from bluest to reddest) correspond to power-law SEDs with β's of −2.2, −1.5, and −0.8, respectively. The red lines (from bluest to reddest) correspond to SEDs computed assuming an e − t/τ star formation history, t = 10 Myr, τ = 70 Myr, [ Z/ Z ☉] = −0.7, the Bruzual & Charlot (2003) libraries, a Salpeter IMF, and dust extinctions E( B − V) of 0.0, 0.15, and 0.3, respectively (Calzetti et al. 2000). These latter models have effective UV-continuum slopes β of −2.2, −1.5, and −0.8 over the range 1600–2300 Å—the same as the black lines. However, the red curves should be much more realistic—being based upon stellar population models (Bruzual & Charlot 2003). We reference the measured colors from each of our dropout samples to this fiducial set of SEDs (red lines) to account for intrinsic differences in the rest-frame wavelengths of the broadband imaging data available for each of our samples (Table 2 and Section 3.4). Also shown (dashed and dotted lines, respectively) are the predicted colors for SEDs computed assuming a young stellar population (a 30 Myr constant SFR model) and a somewhat older stellar population (a model for which star formation proceeded at a constant rate for 100 Myr and then ceased for 10 Myr prior to observation). Dust extinction for these alternate star formation histories is varied so that the UV-continuum slope β is equal to the same values (−2.2, −1.5, and −0.8) as for our fiducial SEDs. In general, the UV-continuum slopes β we derive from the UV colors shown here show little dependence upon the redshift of sources in our dropout samples. Small changes in the mean redshift of our selection (i.e., Δ z ~ 0.1) result in shifts of ~0.02, ~0.02, ~0.01, and ~0.05 in the β's derived for our U-, B-, V-, and i-dropout selections (see the Appendix).
Other Images in This Article
Show More
Copyright and Terms & Conditions
© 2009. The American Astronomical Society. All rights reserved.