Image Details
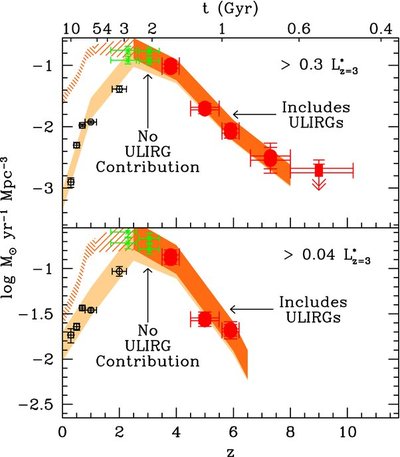
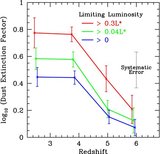
Caption: Figure 13.
Star formation history inferred with (upper set of points, darker orange contours) and without (lower set of points, lighter orange contours) a contribution from highly obscured ultra-luminous infrared bright (>10 12 L ☉) galaxies. Otherwise similar to Figure 11. The top panel is based upon the total UV luminosity density integrated to 0.3 L* z = 3 and the bottom panel is based upon the total UV luminosity density integrated to 0.04 L* z = 3 . At z ~ 2.5, we follow Reddy & Steidel (2009) in using the z ~ 2 IR LF of Caputi et al. (2007) to include the contribution from these ULIRGs, while at z ~ 4, we estimate their contribution based upon ~5–8 good z ~ 4 ULIRG candidates (see Daddi et al. 2009) within the HDF-North GOODS SCUBA supermap (Pope et al. 2006). See also Table 7 and Section 6.2. The darker orange contours at z~0–1.2 show the SFR density derived using the deepest mid-IR/far-IR observations over the GOODS and Far Infrared Extragalactic Legacy (FIDEL) fields (Magnelli et al. 2009). While IR bright galaxies appear to add significantly to the SFR density at low redshift in the upper panel, this is because the lower set of points/orange contours only include galaxies at the bright end of the UV LF (corresponding to the 0.3 L* z = 3 limit) and the UV LF there cuts off at much fainter magnitudes than at higher redshifts (compare this situation to the lower panel where the contribution of the mid-IR/far-IR galaxies is much less on a percentage basis). From this figure, it is clear that the contribution of the luminous IR sources to the total SFR density at z > 2 is only modest (see also Figure 14).
Other Images in This Article
Show More
Copyright and Terms & Conditions
© 2009. The American Astronomical Society. All rights reserved.