Image Details
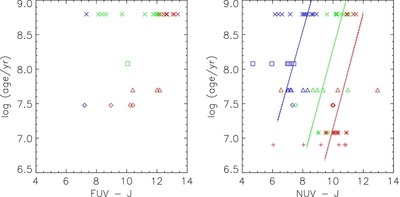
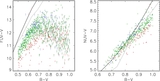
Caption: Figure 9.
Age vs. UV − J diagrams of our cluster and moving group sample. Symbols are the same as in Figure 7. The left panel only shows stars with J + 17.29( J − K) < 13.87, where our FUV observations were complete. In the left panel, red points have J − K > 0.3, green points have 0.2 < J − K < 0.3, and blue points have J − K < 0.2. In the right panel, red points have J − K > 0.8, green points have 0.6 < J − K < 0.8, and blue points have J − K < 0.6. The main difference between these figures and Figure 8 is that we plot Equation (10), which gives the average age at fixed NUV − J rather than the average NUV − J at fixed age. While UV-bright stars do tend to be older than UV-faint stars on average, there is so much scatter at fixed age that the age of any individual star cannot be predicted well.
Other Images in This Article


Show More
Copyright and Terms & Conditions
© 2011. The American Astronomical Society. All rights reserved.