Image Details
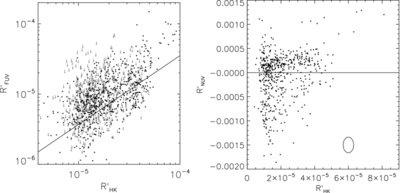
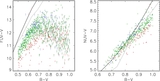
Caption: Figure 6.
R′ UV vs. R′ HK plots of our volume-limited Hipparcos sample. The left panel, a log plot, shows the correlation between R′ FUV and R′ HK. The solid line represents the fit given by Equation (8). The right panel, a linear plot, shows that R′ NUV measurements are very noisy with many negative values. The ellipse shows the median errors. The distribution of R′ NUV is centered on zero.
Other Images in This Article


Show More
Copyright and Terms & Conditions
© 2011. The American Astronomical Society. All rights reserved.
Copyright ©
2025 Astronomy Image Explorer. All Rights Reserved.