Image Details
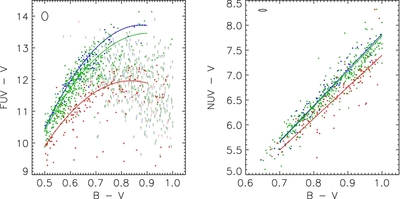
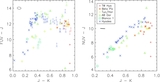
Caption: Figure 2.
UV − V vs. B − V diagrams of our volume-limited Hipparcos sample. Red points are the most active stars, with log R′ HK > −4.5. Green points have −5.0 < log R′ HK < −4.5, while blue points have log R′ HK < −5.0. The ellipses in the upper left corner of either panel show the median errors in color. To illustrate the dependence on activity, we plot Equations (2) and (4) at the median log R′ HK of each bin.
Other Images in This Article


Show More
Copyright and Terms & Conditions
© 2011. The American Astronomical Society. All rights reserved.
Copyright ©
2025 Astronomy Image Explorer. All Rights Reserved.