Image Details
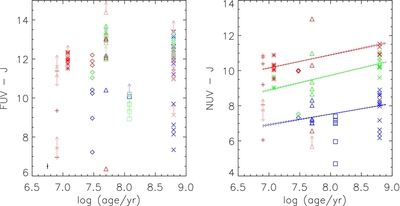
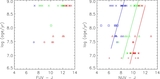
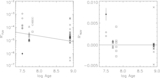
Caption: Figure 8.
UV − J vs. age diagrams of our cluster and moving group sample. Symbols are the same as in Figure 7. In the left panel, red points have J − K > 0.7, green points have 0.4 < J − K < 0.7, and blue points have J − K < 0.4. In the right panel, red points have J − K > 0.8, green points have 0.6 < J − K < 0.8, and blue points have J − K < 0.6. To illustrate the slight trend with age, we plot Equation (9) at the median J − K of each bin.
Other Images in This Article

Show More
Copyright and Terms & Conditions
© 2011. The American Astronomical Society. All rights reserved.
Copyright ©
2025 Astronomy Image Explorer. All Rights Reserved.