Image Details
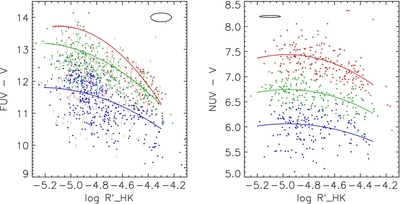
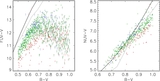
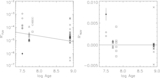
Caption: Figure 3.
UV − V vs. R′ HK diagrams of our volume-limited Hipparcos sample. In the left panel, red points have B − V > 0.8, green points have 0.65 < B − V < 0.8, and blue points have B − V < 0.65. In the right panel, red points have B − V > 0.9, green points have 0.8 < B − V < 0.9, and blue points have B − V < 0.8. The ellipses at the top of either panel show the median errors in color. The utility of the UV as an activity indicator can be seen directly as a downward trend in UV − V color with activity. We plot Equations (2) and (4) at the median B − V of each bin.
Other Images in This Article

Show More
Copyright and Terms & Conditions
© 2011. The American Astronomical Society. All rights reserved.