Image Details
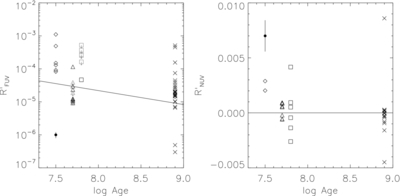
Caption: Figure 10.
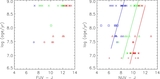
R′ UV vs. age plots of our moving group and cluster sample. Symbols are the same as in Figure 7. The left panel, a log plot, shows the correlation between R′ FUV and age. The solid line represents the fit given by Equation (11). The right panel, a linear plot, shows that R′ NUV measurements appear to be dominated by noise. The filled circle in either panel is not a real point, but illustrates the median error in R′ UV. Both panels include only stars whose inferred spectral type is K5 or hotter, as we lack the models to estimate photospheric UV fluxes for cooler stars. Thus, there are fewer points than in Figure 8, in particular none younger than ~30 Myr.
Other Images in This Article


Show More
Copyright and Terms & Conditions
© 2011. The American Astronomical Society. All rights reserved.