Image Details
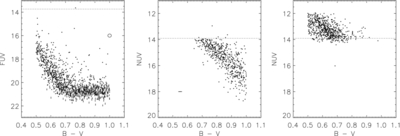
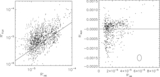
Caption: Figure 1.
UV vs. B − V diagrams of our volume-limited Hipparcos sample, showing the effect of saturation. The dotted line shows the magnitude at which non-linearity effects introduce a 10% or larger error (Morrissey et al. 2007). The ellipses in the upper right of the left panel and the lower left of the middle panel show the median errors in flux and color. The two right panels show the stars that did (center) and did not (right) pass the requirement that V + 6.46( B − V) > 12.8. This cut effectively removed stars that saturated in the NUV, without introducing a bias toward stars that were underluminous in the NUV. Our FUV data do not saturate, so no cut was necessary.
Other Images in This Article


Show More
Copyright and Terms & Conditions
© 2011. The American Astronomical Society. All rights reserved.