Image Details
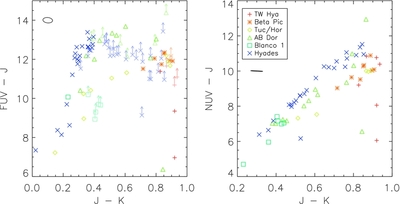
Caption: Figure 7.
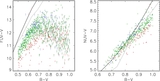
UV − J vs. J − K diagrams of our cluster and moving group sample. Each symbol corresponds to a different association, as shown in the legend, while the hue maps linearly to log age. The ellipses at the upper left of either figure show the median errors in color. The NUV panel shows a clear trend with age, but any relation between FUV and age is obscured by non-detections.
Other Images in This Article


Show More
Copyright and Terms & Conditions
© 2011. The American Astronomical Society. All rights reserved.
Copyright ©
2025 Astronomy Image Explorer. All Rights Reserved.