Image Details
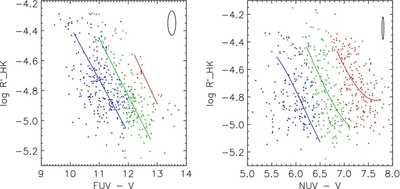
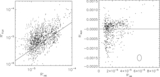
Caption: Figure 4.
R′ HK vs. UV − V diagrams of our volume-limited Hipparcos sample. The left panel only shows stars with V + 12.03( B − V) < 15.5, where our FUV observations were complete. In the left panel, red points have B − V > 0.7, green points have 0.6 < B − V < 0.7, and blue points have B − V < 0.6. In the right panel, red points have B − V > 0.9, green points have 0.8 < B − V < 0.9, and blue points have B − V < 0.8. The ellipses at the top right of either panel show the median errors along each axis. The main difference between these figures and Figure 3 is that we plot Equations (3) and (5), which give the average R′ HK at fixed UV − V rather than the average UV − V at fixed R′ HK.
Other Images in This Article


Show More
Copyright and Terms & Conditions
© 2011. The American Astronomical Society. All rights reserved.