Image Details

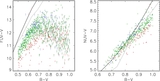
Caption: Figure 11.
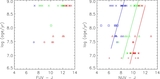
Typical run of our Monte Carlo simulations in Section 4.1. The panel on the left shows the intrinsic color–color relation, without observational errors or selection effects, together with Equation (12), which we used to generate the data. The panel on the right shows the same sample, but with observational errors and flux limits applied, and a fit to the simulated data. On both panels red points are the most active stars, with log R′ HK > −4.5, green points have −5.0 < log R′ HK < −4.5, while blue points have log R′ HK < −5.0. Equation (12) and our fit to the simulated data are plotted at the median log R′ HK of each bin.
Other Images in This Article


Show More
Copyright and Terms & Conditions
© 2011. The American Astronomical Society. All rights reserved.