

Image Details
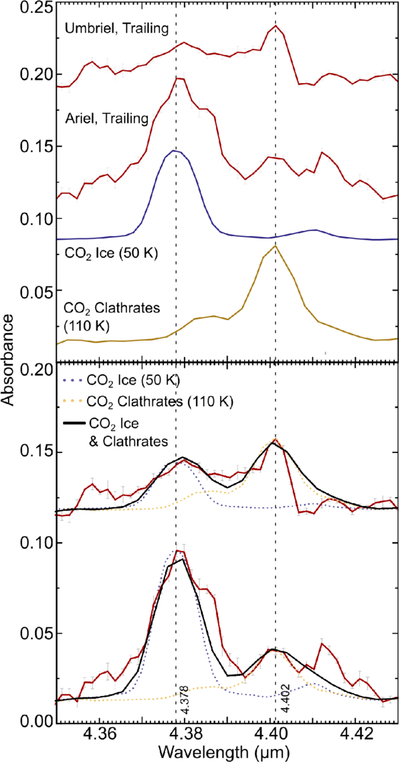
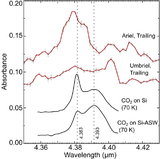
Caption: Figure 8.
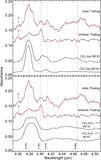
Top: absorbance spectra (–log(reflectance)) of CO2 ice (50 K) measured using INGMAR (e.g., E. Hénault et al. 2025) and CO2 clathrates (110 K; A. Oancea et al. 2012). These laboratory spectra are compared to G395M reflectance data of Ariel trailing and Umbriel trailing, converted to absorbance (–log(reflectance)) and offset vertically for clarity. Bottom: scaled versions of the CO2 ice and CO2 clathrates spectra, and linear combinations of these two laboratory spectra, fit to the G395M data, offset vertically for clarity. These scaled spectra of CO2 ice and CO2 clathrates provide reasonable matches to the 4.38 and 4.4 μm features, respectively. Additional features near 4.36 and 4.41 μm are not well matched by these laboratory species. These scaled spectral data offer useful but nonunique solutions, and other scaled combinations warrant study in future work.
Other Images in This Article
Copyright and Terms & Conditions
© 2026. The Author(s). Published by the American Astronomical Society.

