

Image Details
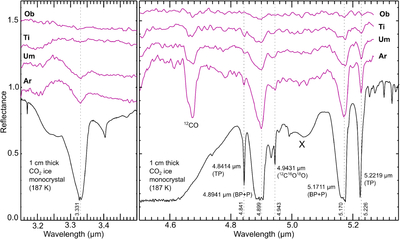
Caption: Figure 5.
Left: Close up of the trailing/leading spectral ratios (3.15 - 3.5 μm) for Ariel (“Ar”), Umbriel (“Um”), Titania (“Ti”), and Oberon (“Ob”) compared to a laboratory spectrum of an ∼1 cm thick monocrystal of CO2 ice (187 K), offset vertically for clarity. The central wavelength (microns) of the 3.331 μm feature (secure detection; Table 2) identified on Ariel and Umbriel (listed vertically along the dotted line) is in close agreement with the center of a strong absorption feature in the laboratory spectrum. Right: the same spectral ratios showing spectral features near 4.899, 5.171, and 5.226 μm (secure detections; Table 2) that align well with the positions of TP and BP + P modes identified in crystalline CO2 ice (R. Bini et al. 1991), although the 5.226 μm feature observed on the Uranian moons appears to be shifted to slightly longer wavelengths compared to the TP mode expressed by the laboratory data (∼5.222 μm). The laboratory spectrum is saturated between ∼3.95 and 4.65 μm due to strong absorption by the CO2 ν3 mode. The Uranian moon spectral ratios exhibit an additional feature near 4.67 μm (Table 3) that is absent from crystalline CO2 ice and results from 12CO ice. Other features exhibited by the Uranian moons (especially Ariel) near 4.84 and 4.94 μm aligns well with a TP mode in 12CO2 and a 12C16O18O feature, respectively (tentative detections; Table 2). Additional “continuum” structure in the laboratory spectrum may result from unattributed modes in crystalline CO2 ice (example marked with an “×” near 5.02 μm).
Other Images in This Article
Copyright and Terms & Conditions
© 2026. The Author(s). Published by the American Astronomical Society.

