

Image Details
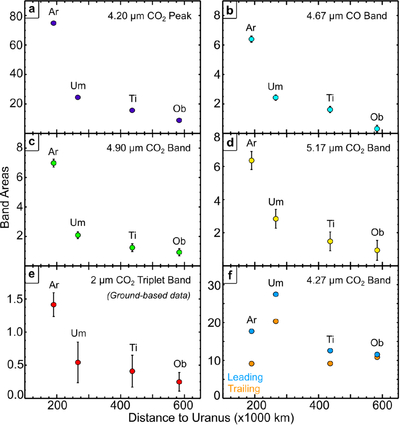
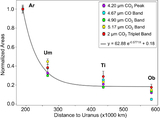
Caption: Figure 4.
Area measurements and 3σ uncertainties for the (a) 4.20 μm CO2 peak, (b) 4.67 μm CO band, (c) 4.90 μm CO2 band, (d) 5.17 μm CO2 band, (e) the “2 μm CO2 triplet band“ (e.g., W. Grundy et al. 2006), and (f) the 4.27 μm CO2 band (in some cases, the 3σ uncertainties are smaller than the symbols shown here). All measurements were scaled up by a factor of 1000 (Table 3). For (a)–(e), only trailing hemisphere measurements are shown as most non-Ariel leading hemisphere measurements are ambiguous (<3σ detection). For the strong 4.27 μm band (f), measurements of both the leading and trailing hemispheres were made for all four moons. The notable disparity in the apparent trends displayed by the 4.27 μm band measurements compared to the other spectral features highlights the challenges and uncertainties in interpreting this feature (see Section 4.1).
Other Images in This Article
Copyright and Terms & Conditions
© 2026. The Author(s). Published by the American Astronomical Society.

