

Image Details
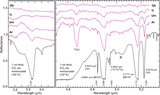
Caption: Figure 2.
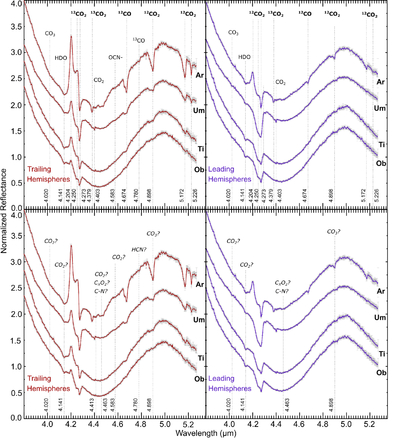
NIRSpec spectra and 1σ uncertainties for Ariel (“Ar”), Umbriel (“Um”), Titania (“Ti”), and Oberon (“Ob”), normalized to 1 at 4.30 μm and offset vertically for clarity (trailing hemisphere data in the left column; leading hemisphere data in the right column). The two upper panels show all features with “confirmed” (bold text) and “favored” compositional interpretations, and the two bottom panels show all features with “ambiguous” (italicized with question marks) compositional interpretations, as described in Section 3.1 and summarized in Table 2. The central wavelengths (microns) for all features are listed vertically along each dotted line and are included in Tables 3, 4, and 5.
Other Images in This Article
Copyright and Terms & Conditions
© 2026. The Author(s). Published by the American Astronomical Society.

