

Image Details
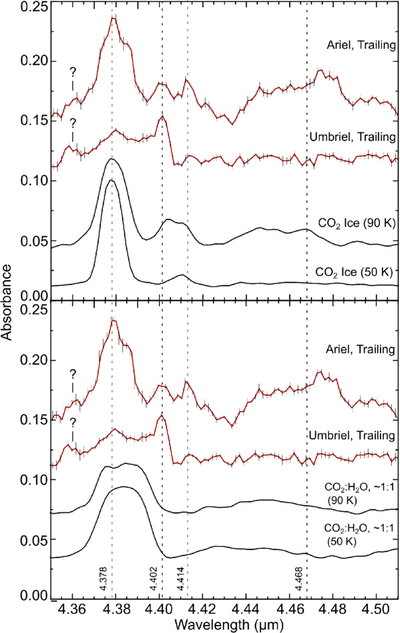
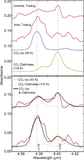
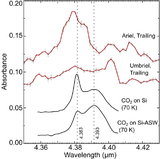
Caption: Figure 7.
Top: absorbance spectra (–log(reflectance)) of a thick CO2 ice layer deposited at 50 K and warmed up to 90 K on an organic residue, measured using INGMAR (e.g., E. Hénault et al. 2025). These laboratory spectra are compared to G395M reflectance data of Ariel trailing and Umbriel trailing, converted to absorbance (–log(reflectance)) and offset vertically for clarity. Bottom: CO2 ice codeposited with H2O ice at 50 K and then warmed up to 90 K, compared to the same Ariel trailing and Umbriel trailing data in the top plot. Dashed lines highlight spectral features identified on Ariel, some of which are also seen on Umbriel, with the approximate central wavelength listed vertically along the lines. The 4.38, 4.40, and 4.41 μm features identified on Ariel match similar spectral features in the CO2 ice layer deposited on an organic residue, in particular at 90 K, comparable to the estimated peak temperatures on the Uranian moons (R. Hanel et al. 1986; M. M. Sori et al. 2017). The match to the Umbriel data, however, is less certain. Additional structure in the CO2 ice laboratory spectrum (90 K) provides a rough match to the short-wavelength side of Ariel’s ∼4.47 μm feature, hinting that CO2 might contribute to this feature, along with other compounds. In contrast, the CO2:H2O mixtures do not provide reasonable matches to either Ariel’s or Umbriel’s 4.38 μm features and do not reproduce the features near 4.4, 4.41, or 4.47 μm. None of the laboratory spectra are able to reproduce a small feature near 4.36 μm detected in the Ariel and Umbriel data (labeled with question marks).
Other Images in This Article
Copyright and Terms & Conditions
© 2026. The Author(s). Published by the American Astronomical Society.

