

Image Details
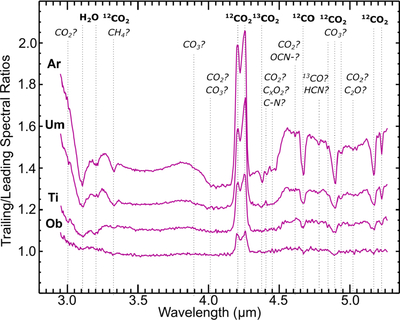
Caption: Figure 3.
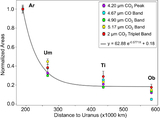
Spectral ratios generated by dividing the trailing hemisphere spectrum by the leading hemisphere spectrum for each moon, offset vertically and with uncertainties omitted for clarity. These ratios highlight the notable hemispherical asymmetries on Ariel (“Ar”), which become progressively weaker on Umbriel (“Um”), Titania (“Ti”), and Oberon (“Ob”). The ratios also reveal subtle features near 3.01, 4.84, 4.93, and 5.02 μm that are not apparent in the nonratio data (unmeasured, tentative detections), possibly associated with thick CO2 ice deposits (R. J. Cartwright et al. 2024a). An additional weak feature near 3.90 μm (unmeasured, tentative detection) in the spectral ratio of Ariel may result from carbonic acid (Table 2).
Other Images in This Article
Copyright and Terms & Conditions
© 2026. The Author(s). Published by the American Astronomical Society.

