

Image Details
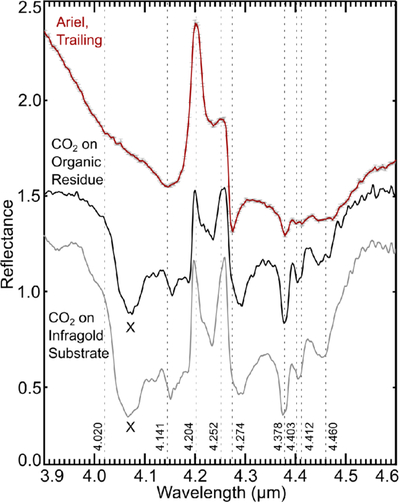
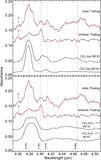
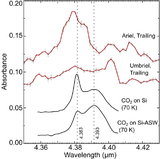
Caption: Figure 6.
G395M data of Ariel’s trailing hemisphere compared to laboratory reflectance data of an ∼10 μm thick layer of CO2 ice deposited on an irradiated organic residue and ∼15 μm thick layer of CO2 ice deposited directly onto an Infragold substrate (both warmed up to 90 K), arbitrarily scaled and offset vertically for clarity. The central wavelengths (microns) for features with secure, probable, and tentative detections (Table 2) in the Ariel spectrum are listed vertically along each dotted line (measurements summarized in Tables 3, 4, and 5). A possible Christiansen feature expressed by the laboratory spectra (marked with an “×”) is notably absent from G395M data of Ariel and the other large moons.
Other Images in This Article
Copyright and Terms & Conditions
© 2026. The Author(s). Published by the American Astronomical Society.

