Image Details
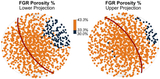
Caption: Figure B2.
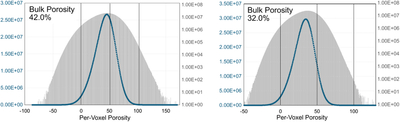
Histograms of per-voxel porosity values for the Murchison 5487 chip (P. Lindgren et al. 2015). For both panels, the blue line shows the data in linear scale (left axis) and the gray bars show the data in log scale (right axis). Left: porosity data calculated using CT-derived end points corresponding to 0% (nonporous phase) and 100% porosity (surrounding air) for conversion. The per-voxel error is 13.7% (2σ), the bulk porosity of the chip is 42.0%, and 1.8% and 0.03% of the chip maps to below 0% and above 100% porosity, respectively. Right: porosity data calculated using the empirically measured bulk porosity from He pycnometry (32.0%). The per-voxel error is 13.6% (2σ), and 1.9% and 0.00002% of the chip maps to below 0% and above 100% porosity, respectively.
Other Images in This Article
Show More
Copyright and Terms & Conditions
© 2026. The Author(s). Published by the American Astronomical Society.