Image Details
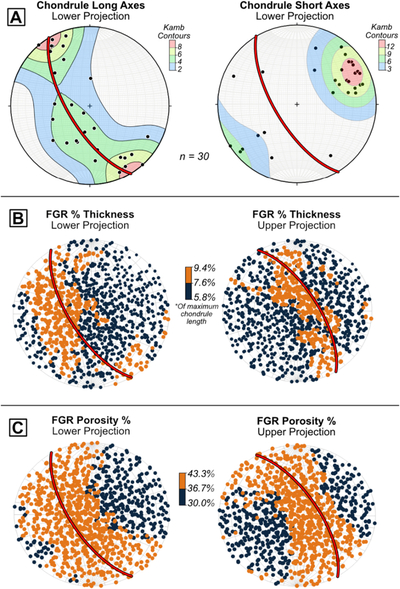
Caption: Figure 4.
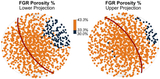
(A) Orientations of the long and short axes of 30 chondrules (including FGRs), showing a foliation fabric. The red curve is the best-fit axial plane to the long-axis distribution (also plotted on the remaining stereonets), showing the orientation of the foliation plane. (B) Average FGR thickness, expressed as a percentage of maximum chondrule length, among all 30 chondrules in the indicated directions. In the (B) and (C) plots, each dot represents a directional measurement, not a discrete chondrule. Both lower (left) and upper (right) projection data are shown. FGRs are generally thicker around the foliation plane (red line). (C) Average FGR porosity among all 30 chondrules in the indicated directions. Both lower (left) and upper (right) projection data are shown. FGRs have higher porosity around the foliation plane (red line).
Other Images in This Article
Show More
Copyright and Terms & Conditions
© 2026. The Author(s). Published by the American Astronomical Society.