Image Details
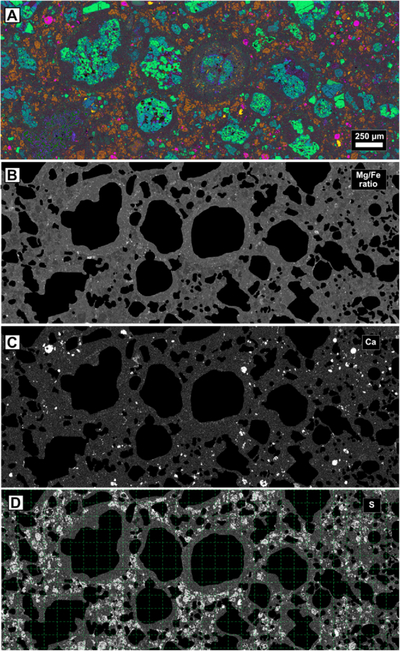
Caption: Figure 8.
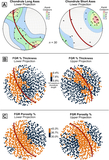
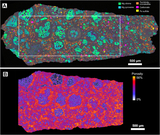
Maps analyzed for correlations between XCT-derived porosity and Mg/Fe ratio, Ca, and S EDS data. Scale bar applies to all images. (A) Same red, green, blue false-color map as Figure 7(A) showing the distribution of chondrules in the analyzed region. (B) Mg/Fe ratio map with chondrule cores masked out. (C) Masked Ca map. (D) Masked S map; the green grid shows the 200 pixel (120 μm) grid size.
Other Images in This Article
Show More
Copyright and Terms & Conditions
© 2026. The Author(s). Published by the American Astronomical Society.
Copyright ©
2026 Astronomy Image Explorer. All Rights Reserved.