Image Details
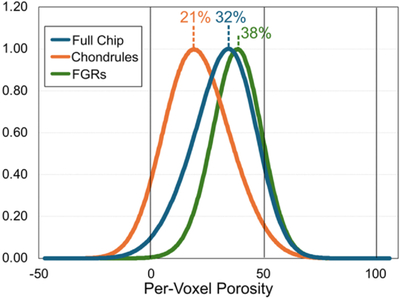
Caption: Figure 3.
Histogram of per-voxel porosity for the full chip and for 30 segmented chondrules and their FGRs (all peaks normalized to 1.0). Also shown are their average porosities. FGRs have a higher average porosity than the chondrules, which also contain significantly more zero-porosity values due to the presence of large nonporous crystalline phases.
Other Images in This Article
Show More
Copyright and Terms & Conditions
© 2026. The Author(s). Published by the American Astronomical Society.
Copyright ©
2026 Astronomy Image Explorer. All Rights Reserved.