Image Details
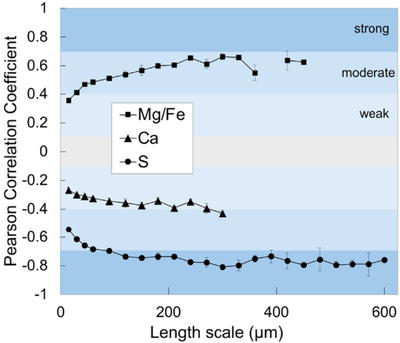
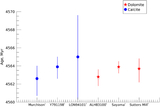
Caption: Figure 9.
Pearson correlation coefficient values between porosity and Mg/Fe, Ca, and S at various grid sizes (length scales) in the matrix and FGRs. Plotted values are averages, and error bars show the standard deviation (only statistically significant correlations, p < 0.001, are plotted). Mg/Fe is moderately positively correlated, and sulfur is strongly negatively correlated with porosity at most length scales. Calcium shows a weak correlation with porosity, although it trends toward a moderate correlation at larger length scales (∼300 μm).
Other Images in This Article
Show More
Copyright and Terms & Conditions
© 2026. The Author(s). Published by the American Astronomical Society.
Copyright ©
2026 Astronomy Image Explorer. All Rights Reserved.