Image Details
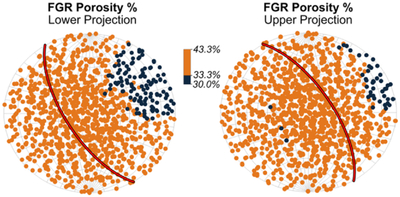
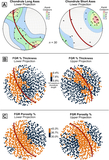
Caption: Figure 5.
Average FGR porosity among all 30 chondrules in the indicated directions. Both lower (left) and upper (right) hemisphere projection data are shown. Directions corresponding to the lowest 25% porosity are shown in blue, and their clustering indicates the likely impact direction. The foliation plane is indicated by the red line.
Other Images in This Article
Show More
Copyright and Terms & Conditions
© 2026. The Author(s). Published by the American Astronomical Society.
Copyright ©
2026 Astronomy Image Explorer. All Rights Reserved.