Image Details
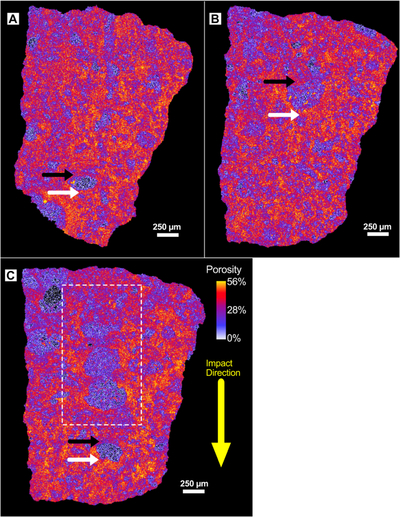
Caption: Figure 6.
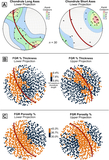
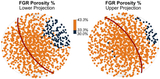
XCT-derived porosity slices 598 (A), 805 (B), and 968 (C). The data have been oriented and resliced parallel to the compression vector (Figure 5), which is directed from the top of the image toward the bottom (large yellow arrow). Porosity and spatial scales are the same for all images. All images highlight an FGR with lower porosity above the chondrule (black arrow) compared to below the chondrule (white arrow). In (C), several chondrules stacked vertically in this orientation (white dashed box) show lower porosity in the FGR regions between them and higher porosity on the sides of the chondrules.
Other Images in This Article
Show More
Copyright and Terms & Conditions
© 2026. The Author(s). Published by the American Astronomical Society.