Image Details
Caption: Figure 2.
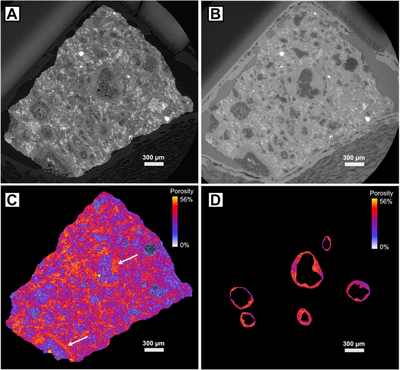
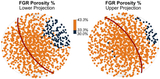
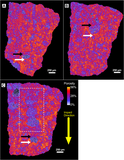
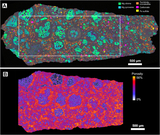
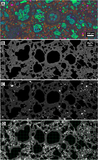
XCT slice 688 of the Murchison USNM 5487 chip. (A) XCT scan in vacuum. (B) XCT scan in xenon at 450 PSIG; the highly attenuating gas has infiltrated the highly porous matrix, making it appear brighter relative to the chondrules. (C) XCT-derived porosity showing the highly porous matrix and locally highly porous FGRs (white arrows); the per-voxel 2σ error is 13.6%. (D) Isolated FGR porosity data showing porosity variations around several FGRs.
Other Images in This Article
Show More
Copyright and Terms & Conditions
© 2026. The Author(s). Published by the American Astronomical Society.
Copyright ©
2026 Astronomy Image Explorer. All Rights Reserved.