Image Details
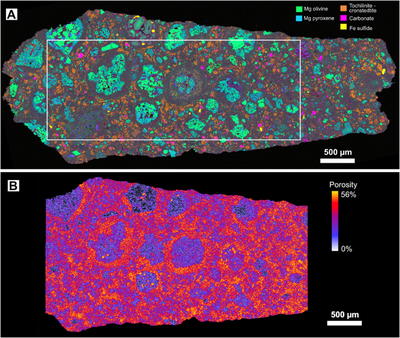
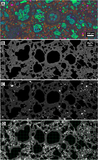
Caption: Figure 7.
(A) EDS X-ray elemental false-color map of the thin section cut from the chip, highlighting various mineral phases. Fe is red, Mg is green, Si is blue, S is yellow, and Ca is magenta. The white box delineates the location of the map area in Figure 8. (B) Matching CT porosity data slice (only a portion of the chip was imaged with XCT).
Other Images in This Article
Show More
Copyright and Terms & Conditions
© 2026. The Author(s). Published by the American Astronomical Society.
Copyright ©
2026 Astronomy Image Explorer. All Rights Reserved.