Image Details
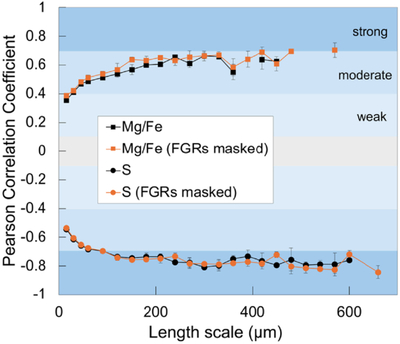
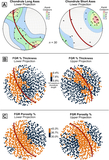
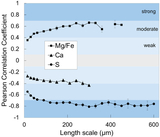
Caption: Figure 11.
Pearson correlation coefficient values between porosity and Mg/Fe and S, at various grid sizes (length scales) for matrix only (orange) and for combined matrix and FGR regions (black). Plotted values represent averages, and error bars indicate the standard deviation (only statistically significant correlations, p < 0.001, are plotted). Correlation strengths are comparable in both cases.
Other Images in This Article
Show More
Copyright and Terms & Conditions
© 2026. The Author(s). Published by the American Astronomical Society.
Copyright ©
2026 Astronomy Image Explorer. All Rights Reserved.