Image Details
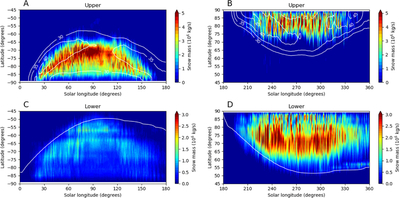
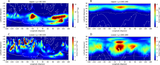
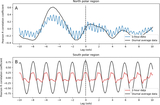
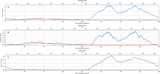
Caption: Figure 4.
Rate of snow mass generation as a function of season and latitude summed over the (A), (B) upper and (C), (D) lower snow generation vertical layers for the (A), (C) southern and (B), (D) northern polar regions. White contours in (A) and (B) show the scaled PV (on the θ = 225 K isentropic surface); in (C) and (D), the white contour shows the approximate seasonal cap edge.
Other Images in This Article
Copyright and Terms & Conditions
© 2026. The Author(s). Published by the American Astronomical Society.
Copyright ©
2026 Astronomy Image Explorer. All Rights Reserved.