Image Details
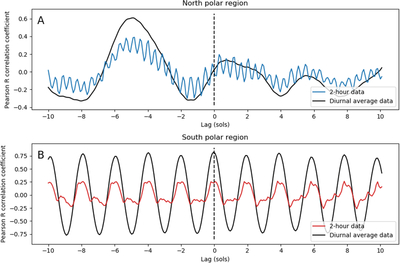
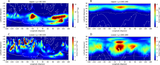
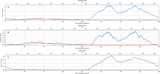
Caption: Figure 9.
Correlation coefficients between the upper and lower layers of snow generation for the period of time shown in Figure 7 for the north (A) and south (B) polar regions. The colored lines show the correlations of the data with two-hour output intervals, and the black lines show the correlations for the 1 sol smoothed data. The correlations between the two layers in each polar region were computed for lags (temporal offsets) of up to ±10 sols between the two layers in intervals of every 2 hr. Lags are for the upper layer with respect to the lower layer, i.e., a positive (negative) lag means that the lower layer shows similar upper-layer behavior that many sols earlier (later).
Other Images in This Article
Copyright and Terms & Conditions
© 2026. The Author(s). Published by the American Astronomical Society.