Image Details
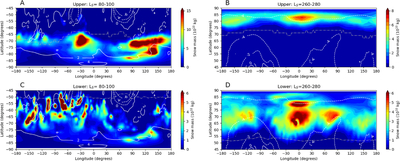
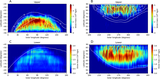
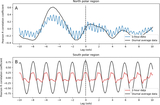
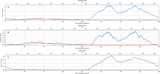
Caption: Figure 6.
Time-integrated total snow generation in the upper (A), (B) and lower (C), (D) vertical layers in the south (A), (C) and north (B), (D) polar regions around the winter solstice. The white solid and dashed contours show the topography for reference (contours every 1 km). The gray dashed–dotted lines in (A) and (B) show the latitude of the maximum of PV on the θ = 225 K isentropic surface, and in (C) and (D) they show the approximate edge of the seasonal polar ice cap.
Other Images in This Article
Copyright and Terms & Conditions
© 2026. The Author(s). Published by the American Astronomical Society.
Copyright ©
2026 Astronomy Image Explorer. All Rights Reserved.