Image Details
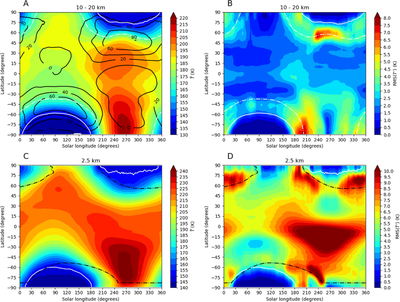
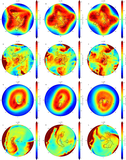
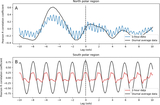
Caption: Figure 1.
Variation of (A), (C) zonal mean temperature between 10 and 20 km and at 2.5 km, respectively, as a function of season and latitude and (B), (D) RMS(T’) between 10 and 20 km and at 2.5 km, respectively, as a function of season and latitude. In (A), the solid black contours are the zonal-average zonal wind (m s−1). In (A) and (B), the 140 K and 170 K contours are in solid white and dashed–dotted white, respectively. In (C) and (D), the white contour is the 150 K contour, and the black dashed–dotted contour is the approximate edge of the seasonal polar ice cap.
Other Images in This Article
Copyright and Terms & Conditions
© 2026. The Author(s). Published by the American Astronomical Society.
Copyright ©
2026 Astronomy Image Explorer. All Rights Reserved.