Image Details
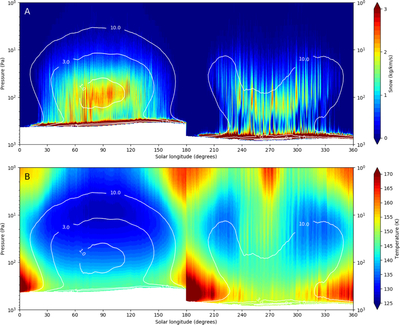
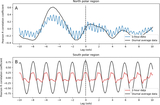
Caption: Figure 2.
(A) Rate of snow mass formed (deposition) within the polar region area (60°–90°) as a function of season and height. The southern polar region is shown for LS = 0°–180° and the northern polar region for LS = 180°–360°. White contours show the deviation in the zonally and meridionally averaged air temperatures in the equivalent polar region (60°–90°) from the deposition (snow-forming) temperature at that height; contours are quasi-logarithmic at 0.2, 0.5, 1, 3, and 10 K. (B) Zonally and meridionally averaged air temperatures in the polar region area (60°–90°) as a function of season and height. The southern polar region is shown for LS = 0°–180° and the northern polar region for LS = 180°– 360°. White contours are the same as in (A).
Other Images in This Article
Copyright and Terms & Conditions
© 2026. The Author(s). Published by the American Astronomical Society.