Image Details
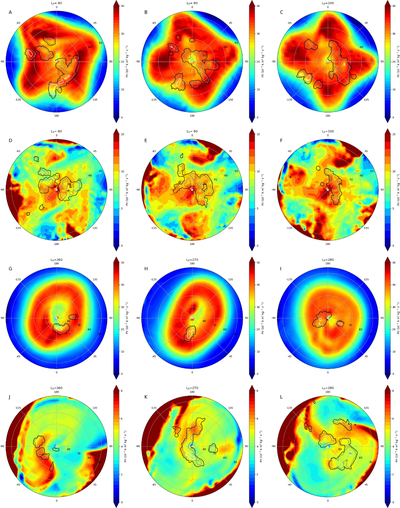
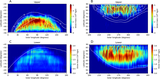
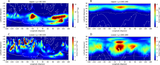
Caption: Figure 5.
Maps of PV (color fill background) and simulated snow mass generation (contours) at three instants of time before, at, and after the winter solstice for the southern (A)–(F) and northern (G)–(L) polar latitudes. Contours are shown for 1 (black), 10 (gray), 100 (white), and 300 (silver) × 102 kg s−1 of snow generated at the instant shown. The first and third rows (A)–(C), (G)–(I) show the upper layer in the south and north polar regions, respectively, while the second and last rows (D)–(F), (J)–(L) show the lower layer in the south and north polar regions, respectively. The θ = 225 K isentropic surface is shown as representative of the upper layer, and θ = 150 K (north) and θ = 175 K (south) isentropic surfaces are shown as representative of the lower layer.
Other Images in This Article
Copyright and Terms & Conditions
© 2026. The Author(s). Published by the American Astronomical Society.