Image Details
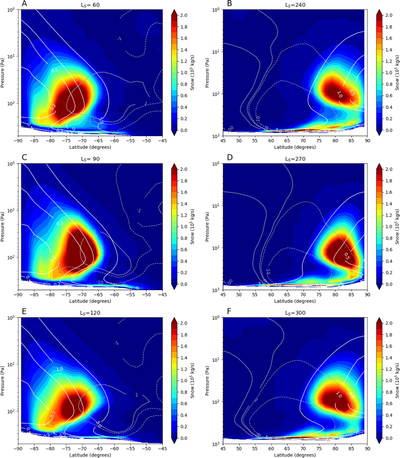
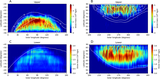
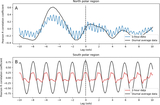
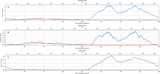
Caption: Figure 7.
Zonal-summed and 30 sol averaged snow generation rates for both the south (A), (C), (E) and north (B), (D), (F) polar regions at periods before (A), (B), at (C), (D), and after (E), (F) the winter solstice in each respective hemisphere. The white contours show the difference between the zonally and temporally averaged air temperature and the deposition temperature of CO2 at that pressure level, with contours at 0.2, 0.5, 1, and 5 K differences. Gray contours show the mean meridional circulation in units of 107 kg s−1, with contours at values of ±1, 10, and 100. Negative values are dotted lines, and positive are solid lines. Positive circulation is clockwise in the plane of the figure.
Other Images in This Article
Copyright and Terms & Conditions
© 2026. The Author(s). Published by the American Astronomical Society.