Image Details
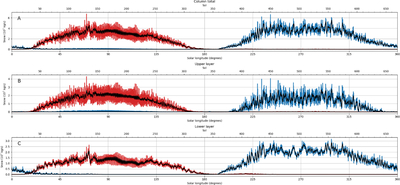
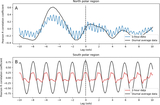
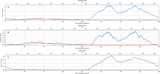
Caption: Figure 3.
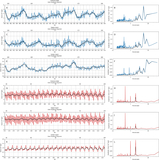
Rate of snow mass formed within the polar region area (latitudes 45°–90°) as a function of season summed over (A) the total column, (B) the upper layer, and (C) the lower layer. (For the definitions of the extent of the vertical layers, which are slightly different in each polar region, see Figure 1). The southern polar region is in red, and the northern polar region is in blue. The black lines show a 1 sol running mean for the south and north polar regions. Note the vertical axis scales vary between (A), (B), and (C).
Other Images in This Article
Copyright and Terms & Conditions
© 2026. The Author(s). Published by the American Astronomical Society.
Copyright ©
2026 Astronomy Image Explorer. All Rights Reserved.